Plotting in Python

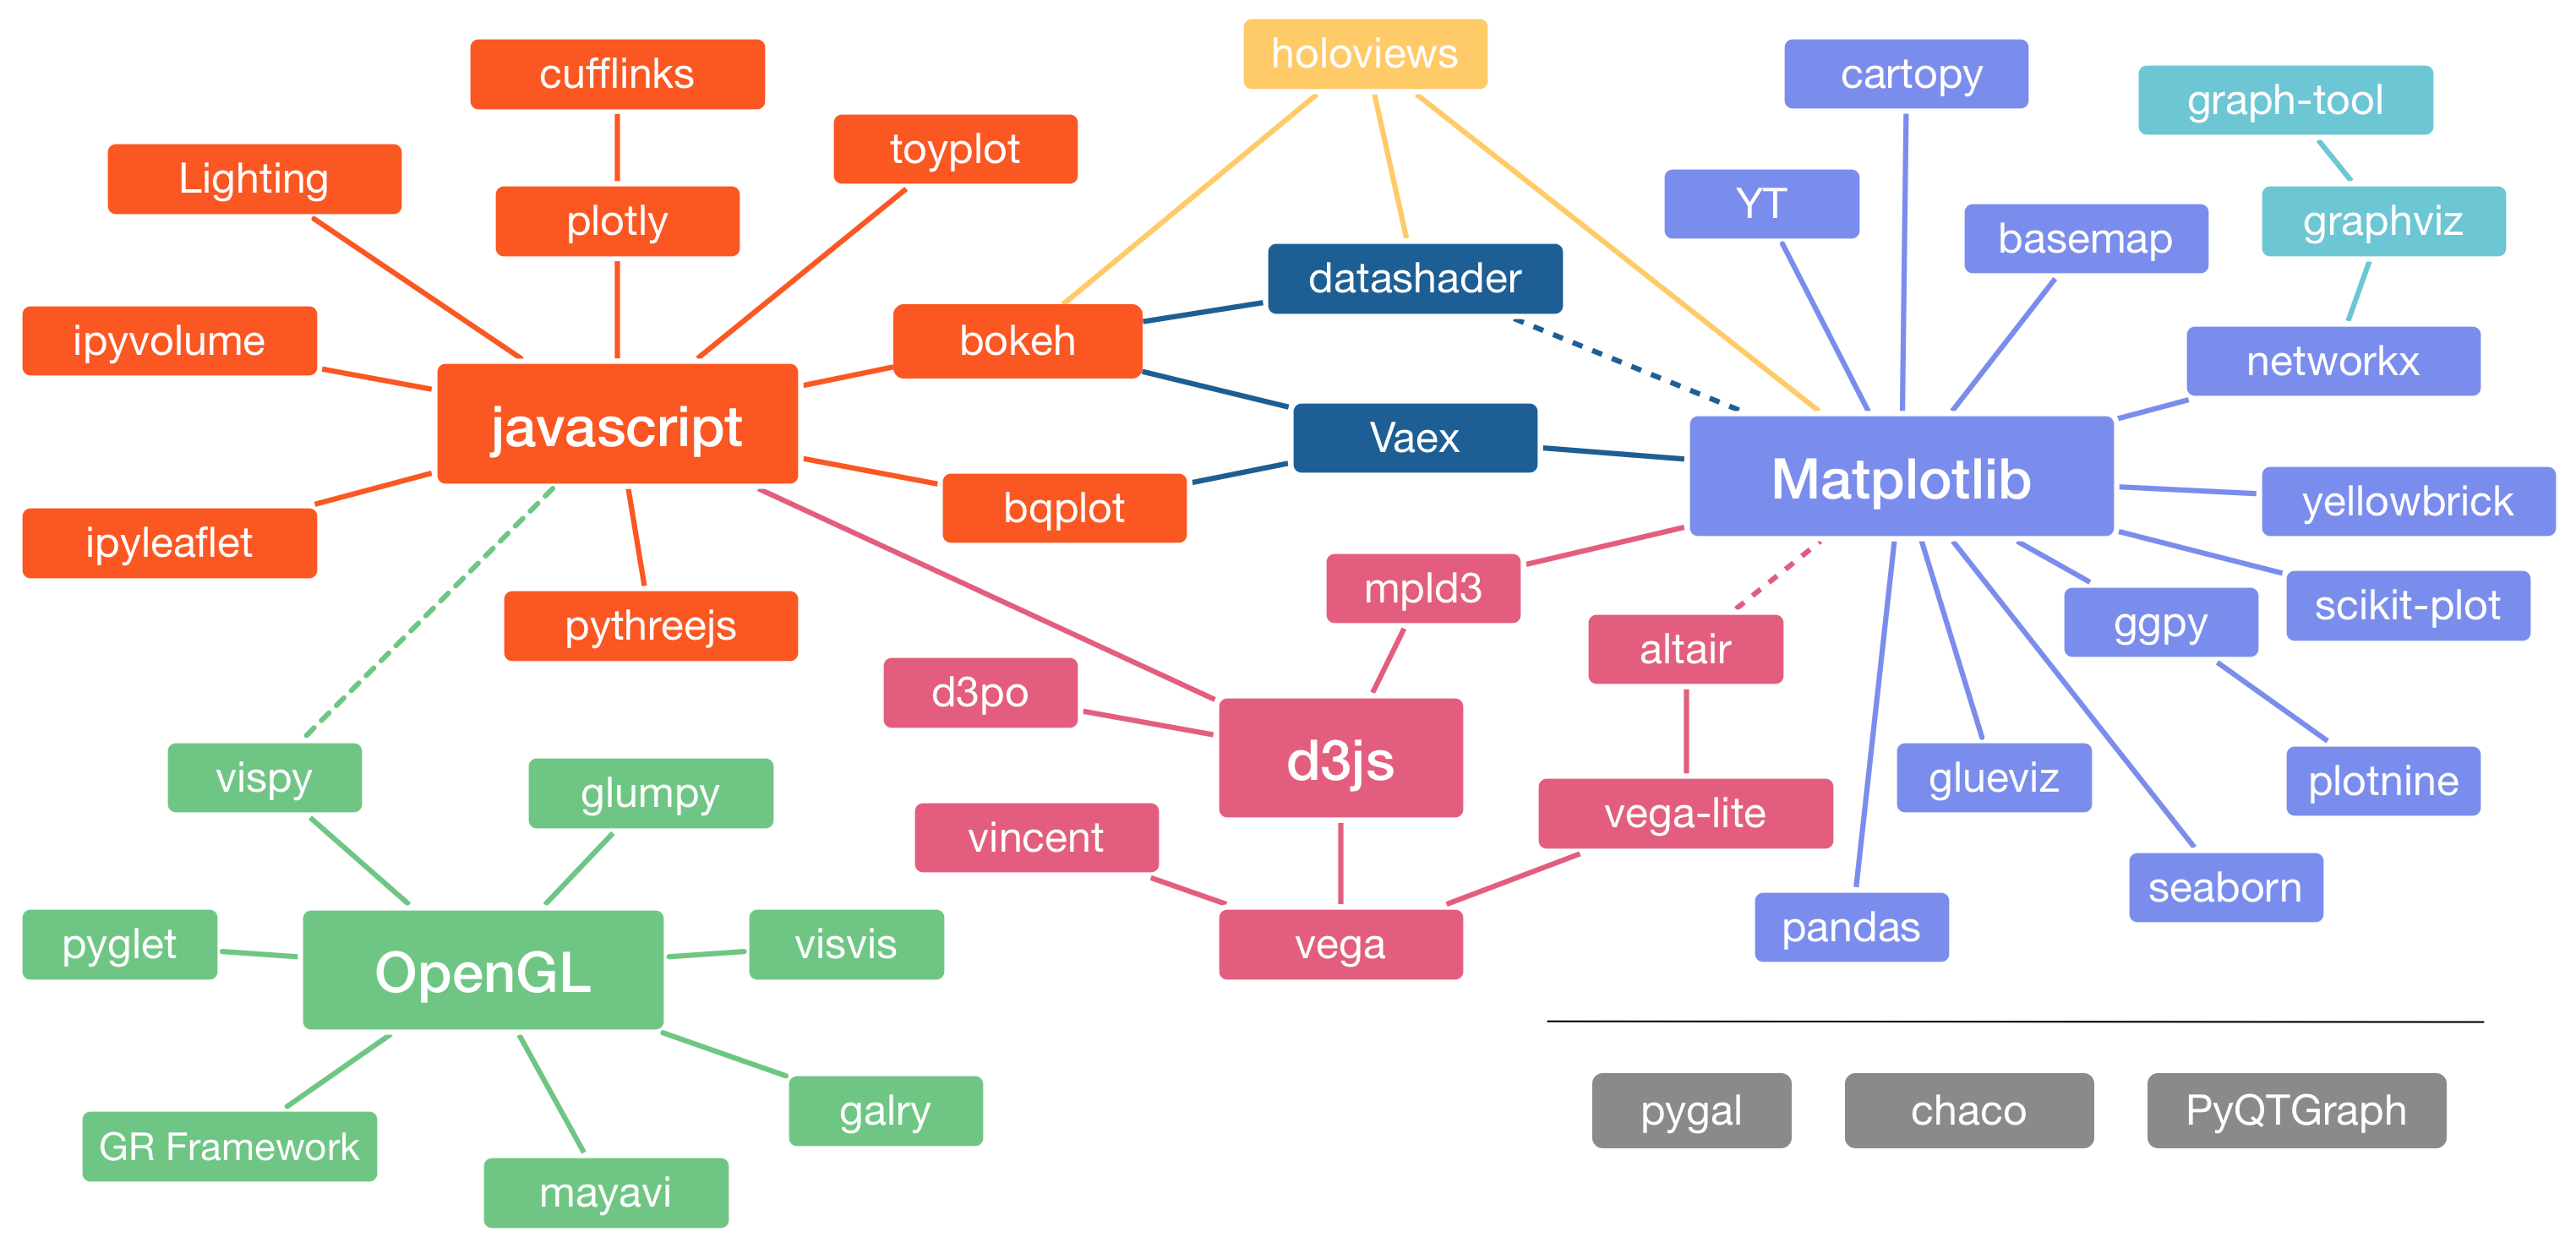
Plotting libraries available in Python. Source: https://pyviz.org/overviews/index.html.
Python has many nice, useful libraries that can be used for plotting. In the figure above, you can see a number of the available plotting library options, along with how they relate to one another. Of the options above, we would like to highlight:
- Matplotlib - “the grand old man of Python plotting” (Matplotlib gallery)
- Matplotlib Basemap - Matplotlib plugin for visualizing maps in Python (Matplotlib basemap gallery)
- Seaborn - High-level interface for drawing attractive statistical graphics that is built on top of Matplotlib (Seaborn gallery)
- Bokeh - Modern plotting library for static / interactive web-based plots such as graphs, maps, charts etc. (Bokeh gallery)
- Plotly - Modern plotting library for static / interactive web-based plots such as graphs, maps, charts etc. Some features are commercial. (Plotly gallery)
- Dash - Dash is a Python framework for building analytical web applications. No JavaScript required.
- ggplot - Familiar with doing plots in R using ggplot2? You can use ggplot in Python too! (ggplot examples)
- HoloViews and GeoViews - Let the data visualize itself. (see this HoloViews introductory video)
- Modern and powerful visualization libraries built on top of Matplotlib and Bokeh that makes exploring and visualizing your data quicker than ever before
- HoloViews is designed for basic plotting (HoloViews tutorial and HoloViews examples)
- GeoViews is designed for creating nice and interactive maps (GeoViews gallery)
Attention
Explore the galleries and examples of different visualization libraries above to learn what’s possible to do in Python.
As you can see from the examples, the plotting possibilities in Python are numerous and rich. Do you need to know them all? Of course not. Not even we do. It is not even rational for trying to use them all, instead you should start by learning to use one of them that suits your needs and then later extend your knowledge and skills to other visualizing libraries when necessary. In our courses, we will be start our plotting experiments with Matplotlib and Plotly that makes it possible to store and show our interactive plots in the web.
Note
Later, in the Automating GIS processes course, we will be learning a little bit of Bokeh as well. We will likely work also in Matplotlib in the Introduction to Quantitative Geology course.